Sustainable/Impact Investing] IRENA Global Renewables Outlook 2025 (Tracking the UAE Consensus)
Global renewables remain off-track to meet COP28 goals. Ahead of COP30 in Brazil, IRENA’s 2025 Outlook urges tripling capacity, doubling efficiency, and scaling blended finance to close a $2.8T gap—highlighting emerging-market opportunities and shifting ESG focus to real-economy impact.
![Sustainable/Impact Investing] IRENA Global Renewables Outlook 2025 (Tracking the UAE Consensus)](/content/images/size/w1200/2025/10/Screenshot-2025-10-21-215950-1-1.png)
Hi All,
I wanted to share the key takaways from the latest IRENA report which was mentioned by João Marcos Paes Leme, Deputy Minister for Energy, Brazil, at Baker Institute’s strategic dialogue on Recalibration of Climate Leadership and Capital (Oct 15, 2025).
The UAE Consensus, established at COP28, frames the central organizing principle for the global energy transition with its mandate to 1) triple renewable energy capacity and 2) double energy efficiency by 2030. These goals are not merely aspirational; they represent a critical pathway to align global efforts with the 1.5°C climate target. This IRENA's analysis ahead of COP30 in Brazil provides a data-driven assessment of the world's current progress, highlighting both significant achievements and the critical shortfalls that define the strategic challenge for investors, policymakers, and industry leaders in the years ahead.
Please share your thoughts and reflection on this. Always welcome your feedback on the post as well.
Executive Summary
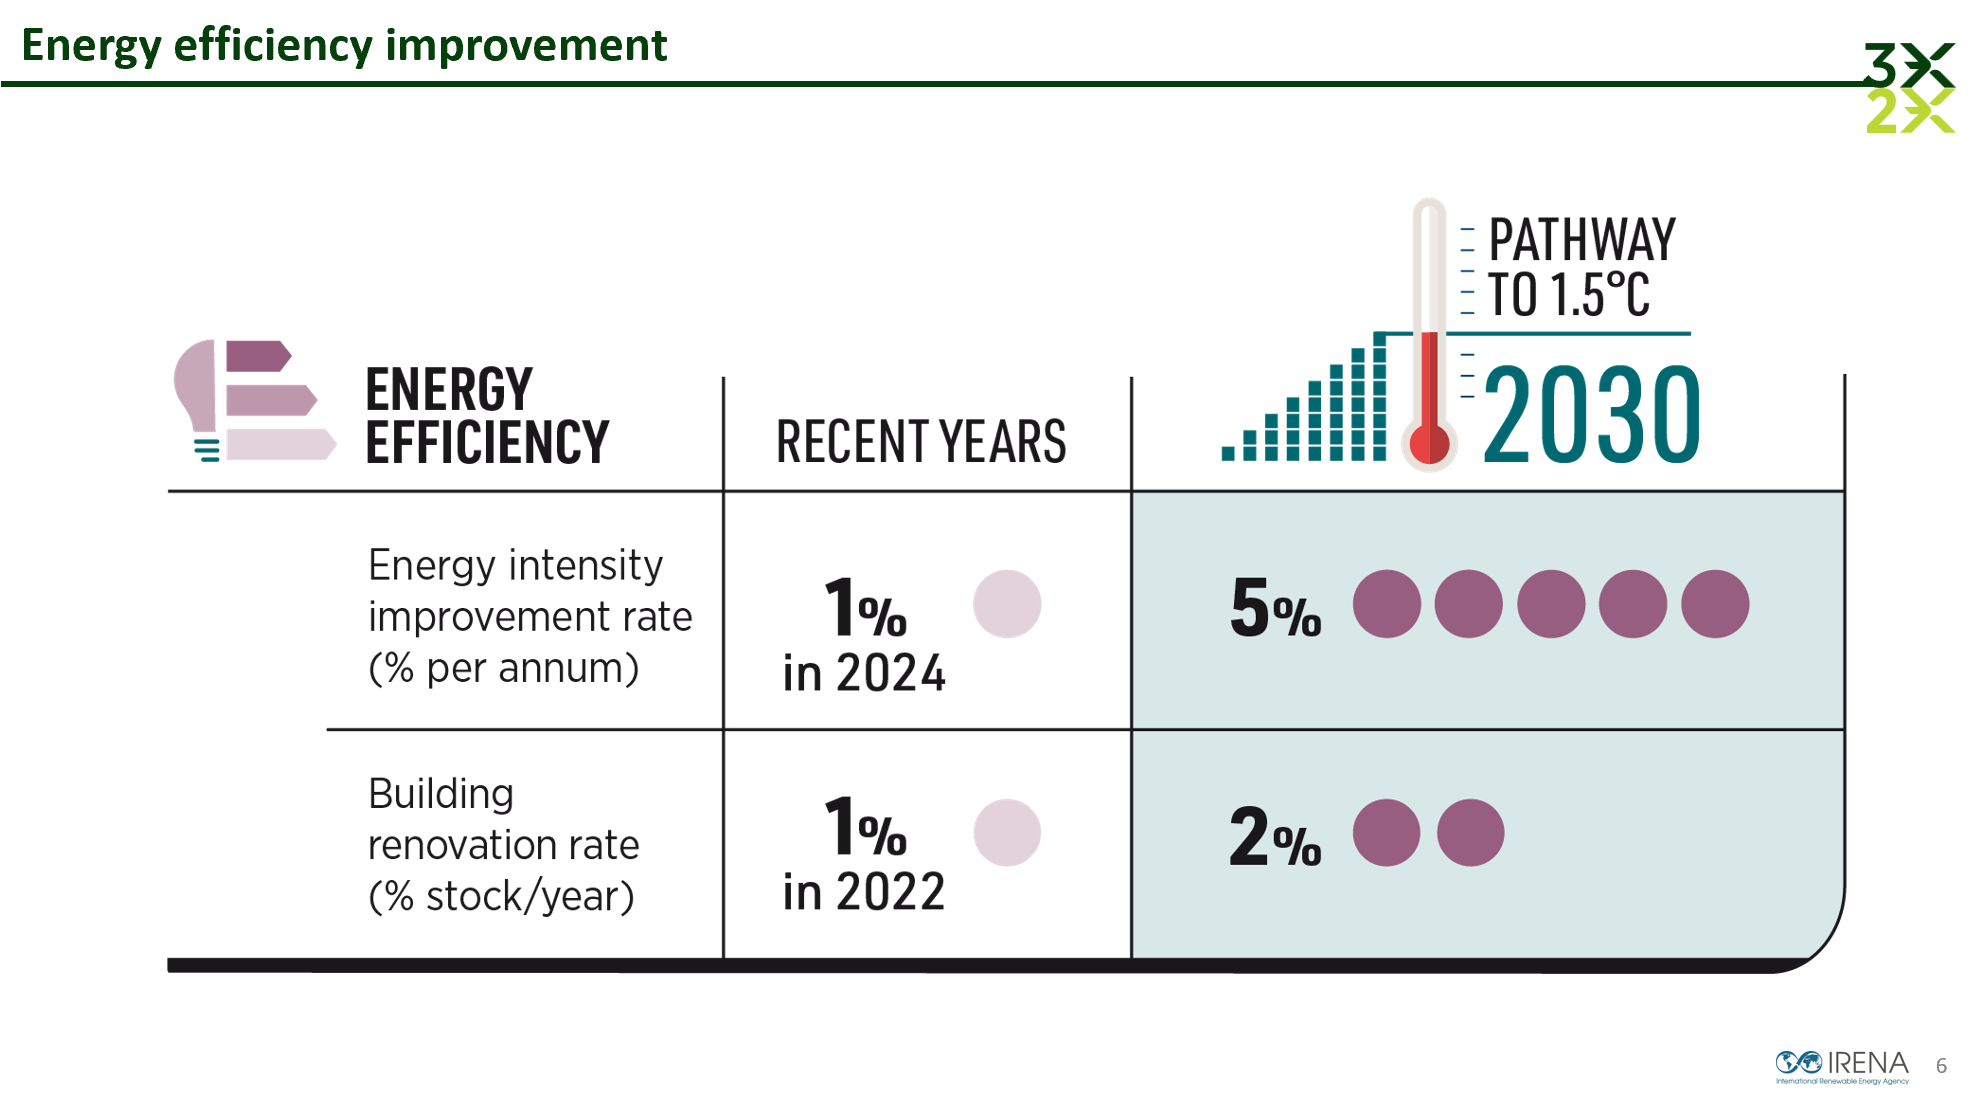
- The world is off-track: Despite record growth in renewable power in 2024, particularly solar, the report highlights that the pace is still insufficient to meet the 2030 targets, especially regarding the negligible progress in energy efficiency improvements. Renewable capacity must triple by 2030 (to ~11,000 GW), but current deployment (~473 GW/year) covers less than half the required annual pace. The energy efficiency rate is at 1% vs. 4% required per annum.
- Capital imbalance: There is a critical need for streamlining permitting processes, modernizing grid infrastructure, and urgently mobilizing international finance for developing economies to ensure a just and equitable energy transition. Of the USD 1.8 trillion invested in 2023, 80% went to advanced economies; emerging markets remain underfinanced and face 3–4× higher capital costs.
- Uneven renewable deployment across regions: There is a geographical imbalance in renewable deployment and the current status of Nationally Determined Contributions (NDCs) in relation to the global goals. Most new solar and wind capacity is concentrated in China, the EU, and the US, while emerging markets (Africa, South Asia, Latin America) contribute very little despite huge potential.
- 💡 Implication for capital allocators: Most transition capital is chasing opportunities in already well-funded markets, leaving high-growth, under-electrified regions underinvested — which is where both the largest climate gap and highest marginal returns now lie.
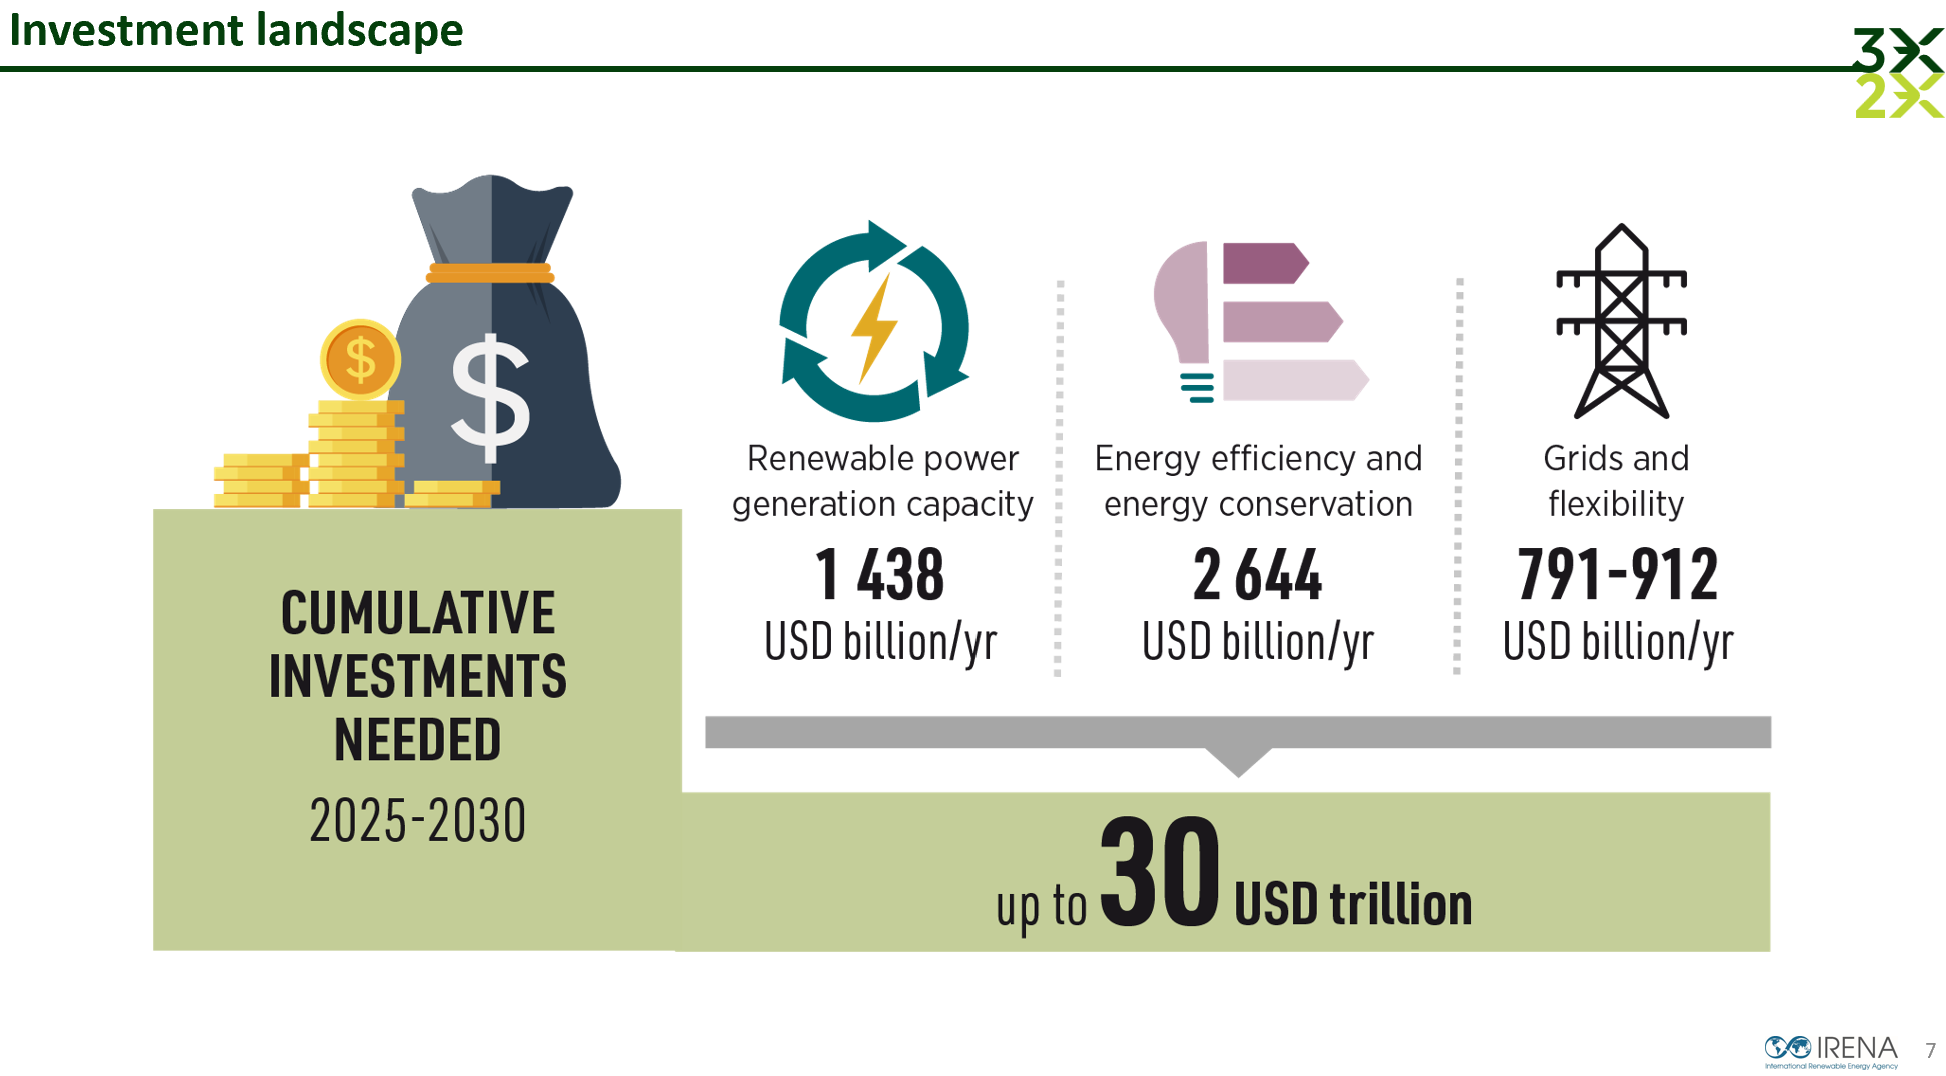
- Priority shift needed: Investment must pivot from mature solar/wind toward grids, storage, green hydrogen, and industrial decarbonization, requiring USD 2 trillion/year through 2030.
- Investor takeaway: The main constraint is cost of capital, not technology — highest returns and impact lie in enabling infrastructure and de-risked emerging-market renewables via blended finance and MDB reform.
Here is the report:
Too busy to read the summary? Listen to the podcast style audio summary put together by Google Notebook LLM:
Or in a video format:
⚡ Global Transition Snapshot
- Global renewables capacity (2024): ~3,870 GW
- Required by 2030: ~11,000 GW (tripling baseline)
- Annual additions required: ~1,000 GW/year vs. ~473 GW achieved in 2023
- Investment gap: ≈ USD 2.8 trillion cumulative shortfall by 2030
💸 Capital Allocation Trends
- Energy transition investment (2023): USD 1.8 trillion
- 80% concentrated in China, EU, US
- Emerging markets receive <15% despite holding 60% of population potential
- Private capital flows are increasingly skewed toward mature tech (solar, wind), leaving underinvestment in enabling infrastructure (grids, storage, flexibility).
- NDCs (Nationally Determined Contributions) — the official climate targets each country submits under the Paris Agreement — also don’t add up globally. Many are too weak or outdated, and don’t align with the COP28 UAE Consensus goal to triple renewables and double efficiency by 2030.
- In short: the global energy transition is geographically unbalanced — both in terms of where renewables are being built and how ambitious countries’ policy commitments (NDCs) currently are.
- Public finance leverage is declining — concessional funds and MDBs remain below target mobilization ratios (1:5 leverage achieved vs. 1:10 required). In short: public finance isn’t stretching far enough — it’s catalyzing only half the private investment needed to meet global transition goals.
- Implication for allocators: Infrastructure and emerging-market renewables present the highest marginal impact per dollar, but require de-risking frameworks (FX guarantees, blended finance, policy stability).
🧱 Sectoral Priorities
| Sector | Current Status | Required Acceleration | Key Opportunity |
|---|---|---|---|
| Power | 86% of new capacity renewables | Maintain 1 TW/yr growth | Grid-scale storage, digital grids |
| Industry | 10% renewables share | 3× by 2030 | Green hydrogen, electrification |
| Transport | <5% renewables | 5× by 2030 | EVs, e-fuels, charging infra |
| Buildings | 26% renewables heat | 2× by 2030 | Heat pumps, distributed solar |
| Agriculture & AFOLU | Low uptake | 3× by 2030 | Bioenergy, nature-based carbon |
🏦 Financial System Implications
- Private finance dominance: 75% of total investment is private, but poorly diversified.
- MDB/DFI reform critical: They must shift from project-level to systemic de-risking, using guarantees, first-loss capital, and local currency tools.
- Carbon markets and transition credits will play an increasing role in bridging liquidity for hard-to-abate sectors.
Key takeaway: The cost of capital is the true determinant of transition pace — currently 3–4× higher in developing economies. Financial innovation (FX hedging, pooled vehicles, credit enhancement) is more impactful than incremental technology cost reductions.
🌍 Regional Hotspots
- China: 50% of global solar/wind growth, supply-chain dominance continues.
- US: IRA driving record utility-scale renewables, but grid bottlenecks persist.
- EU: Capex focus shifting to grid modernization and hydrogen hubs.
- India & ASEAN: High growth, but underfinanced; blended vehicles and sovereign guarantees needed.
- Africa: 1% of global renewable investment; risk premium unsustainably high.
📊 Investment & Portfolio Insights
- Blended finance is the bridge between institutional liquidity and frontier-market demand.
- Thematic opportunities:
- Grid flexibility and digitalization
- Green hydrogen hubs
- Transition metals and recycling loops
- Distributed solar for industrial SMEs
- ESG metrics are evolving toward “real economy alignment” — expect portfolio reporting standards to integrate “transition intensity” (MtCO₂/$ invested).
- Note) Traditional ESG metrics (like ESG scores or exclusions) mostly measure company policies or risk management practices. In essence: ESG reporting is moving from “Are we holding green companies?” to “Are our dollars driving measurable decarbonization in the real economy?”
- 💡 For investors: expect new disclosure standards that quantify the carbon efficiency of capital — linking financial performance to physical emissions outcomes. The next phase of ESG — “real economy alignment” — shifts focus to actual impact: how much a portfolio contributes to real-world emission reductions. “Transition intensity” (MtCO₂ / $ invested) is a proposed metric showing how much carbon a dollar of investment helps abate (or, conversely, how carbon-intensive it remains).
📅 Timeline to COP30
- 2025: Year of “course correction.” Countries expected to table revised NDCs aligned with tripling goal.
- 2026–2030: Execution phase — financing pipelines must double to >USD 2 trillion/year in renewables alone.
- Post-2030 outlook: Renewables could reach 65–70% of total generation if current policies and finance reforms are met.
🔑 Takeaways for Investors
- Repricing of risk — cost of capital, not technology cost, is the main bottleneck.
- Infrastructure & enabling assets (grids, storage, transmission) are the next frontier.
- Emerging-market renewables are the highest-impact, lowest-penetration opportunity class.
- Blended and transition finance vehicles are essential for scaling private capital deployment.
- Portfolio positioning: overweight in power grids, green hydrogen, and transition minerals; underweight in fossil-transition equities unless backed by credible decarbonization plans.
Deep-dive: Detailed Summary
1.0 The 2030 Mandate: An Assessment of Global Progress
1.1 A Two-Speed Transition: The Solar Success Story Masks Systemic Shortfalls
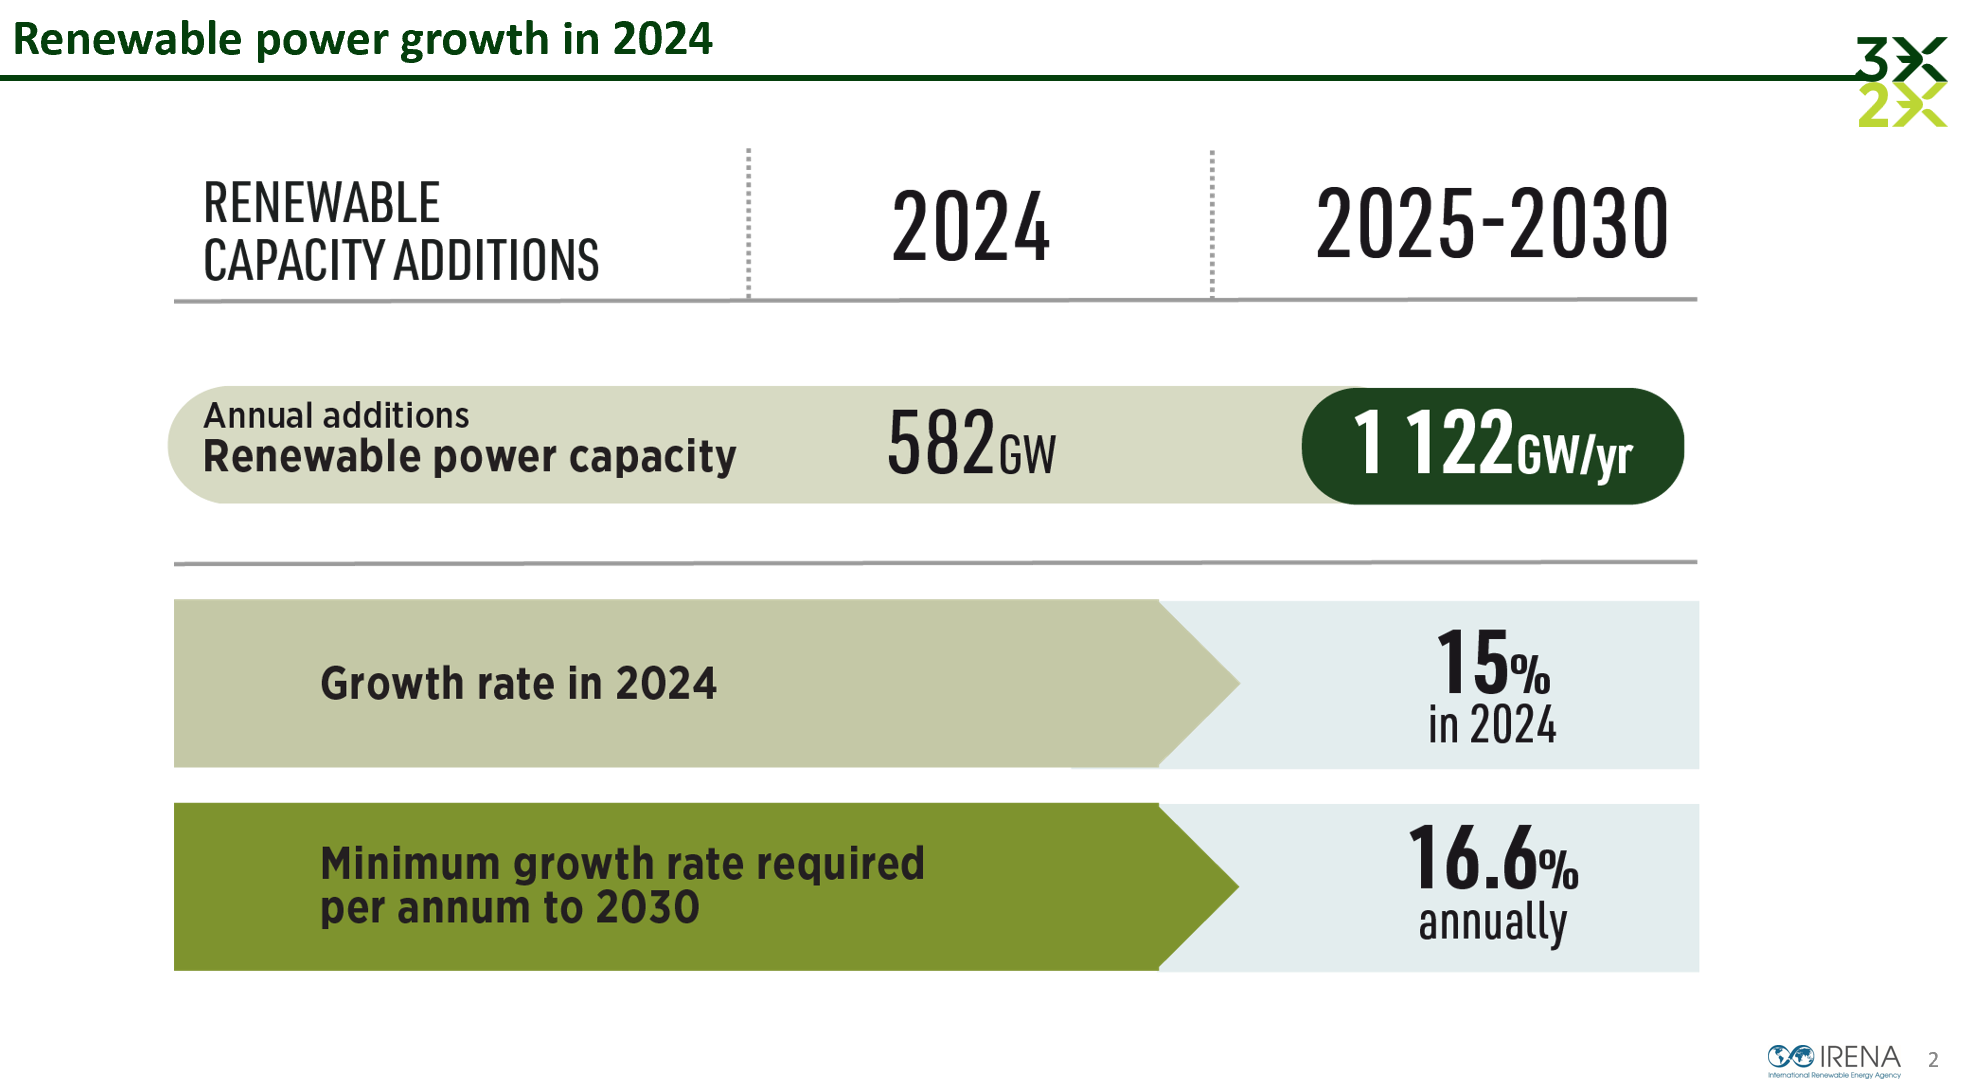
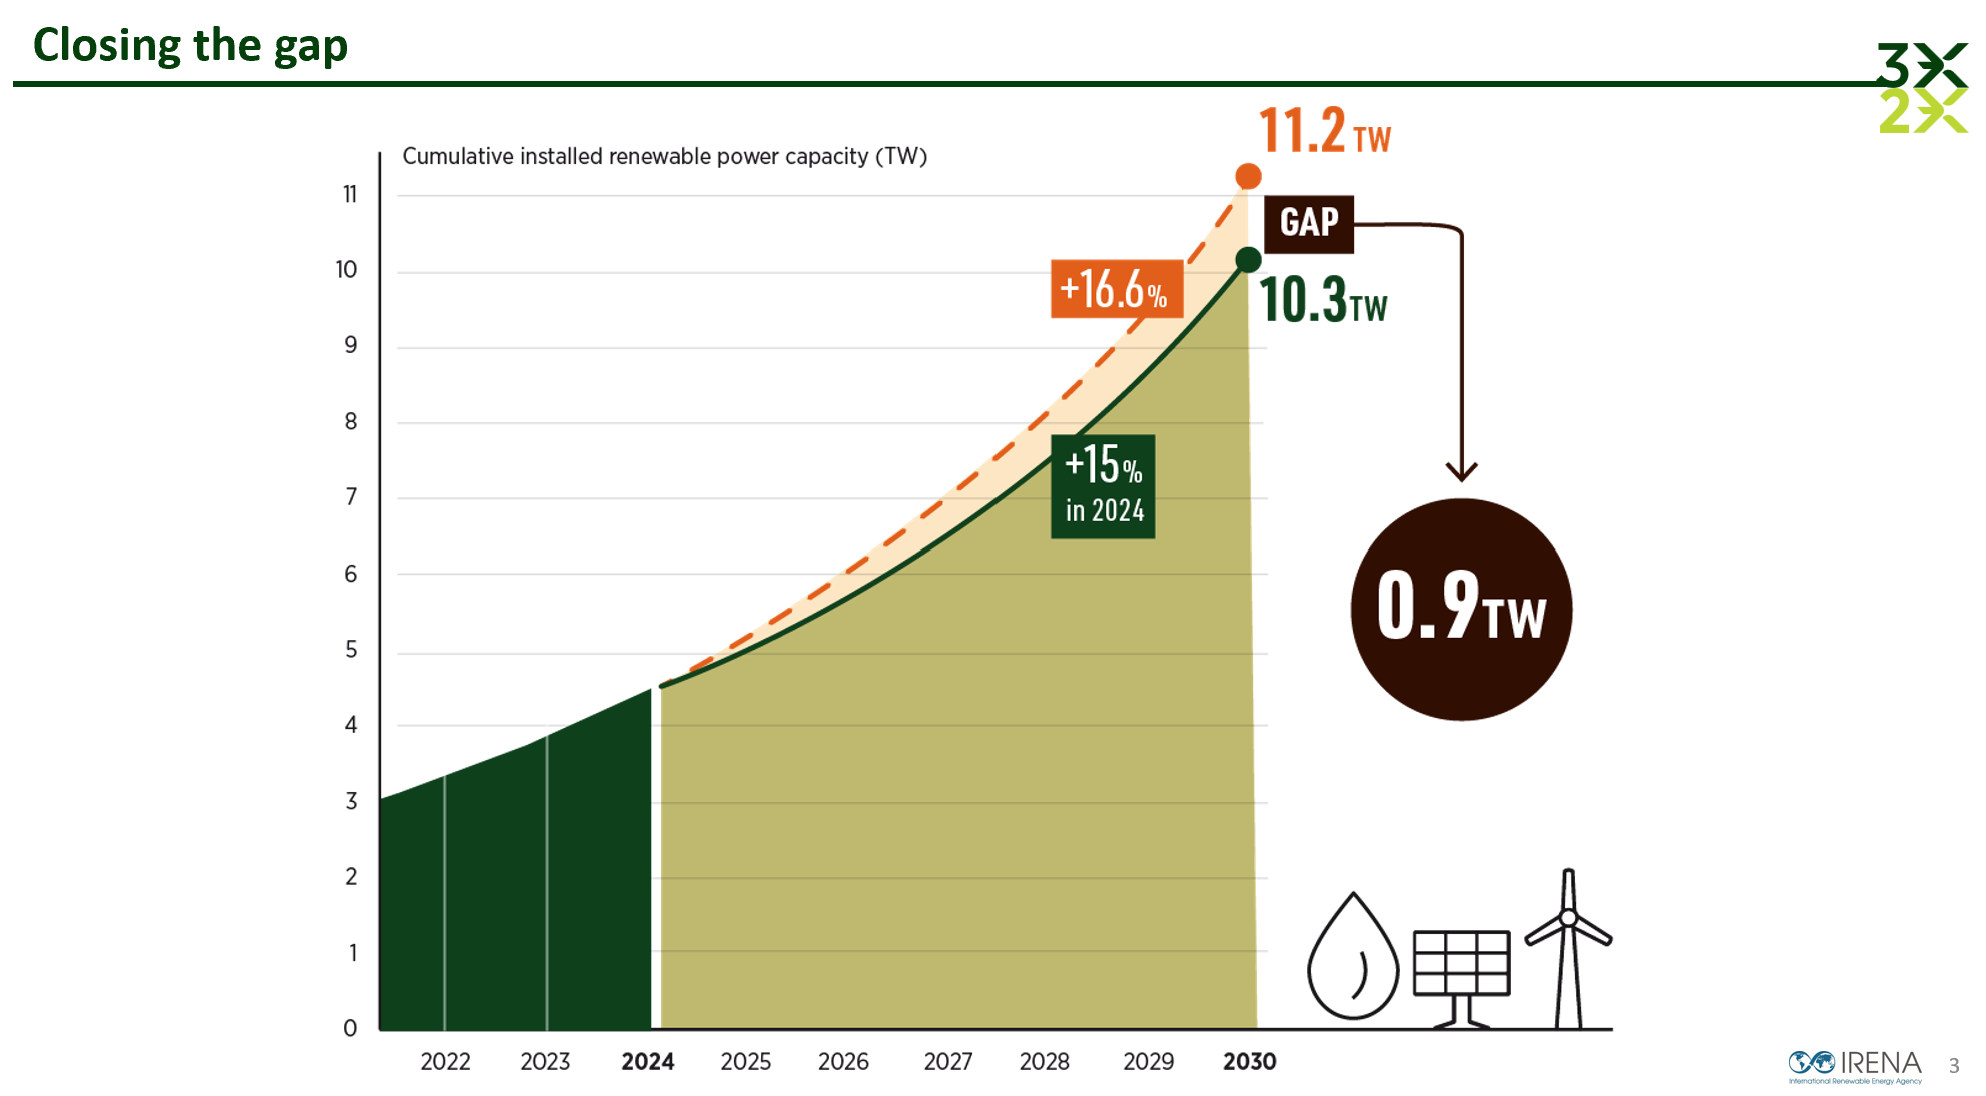
The global deployment of renewable power continues to accelerate, setting a new record with 581.9 GW of new capacity added in 2024. However, this progress falls short of the pace required to meet the 2030 tripling goal. To achieve the target of 11.2 TW, an average of 1,122 GW must be added annually between 2025 and 2030. If the current growth rate persists, the world is projected to fall short by 0.9 TW, a gap equivalent to the entire installed renewable capacity of North, Central and South America, and the Caribbean, combined.
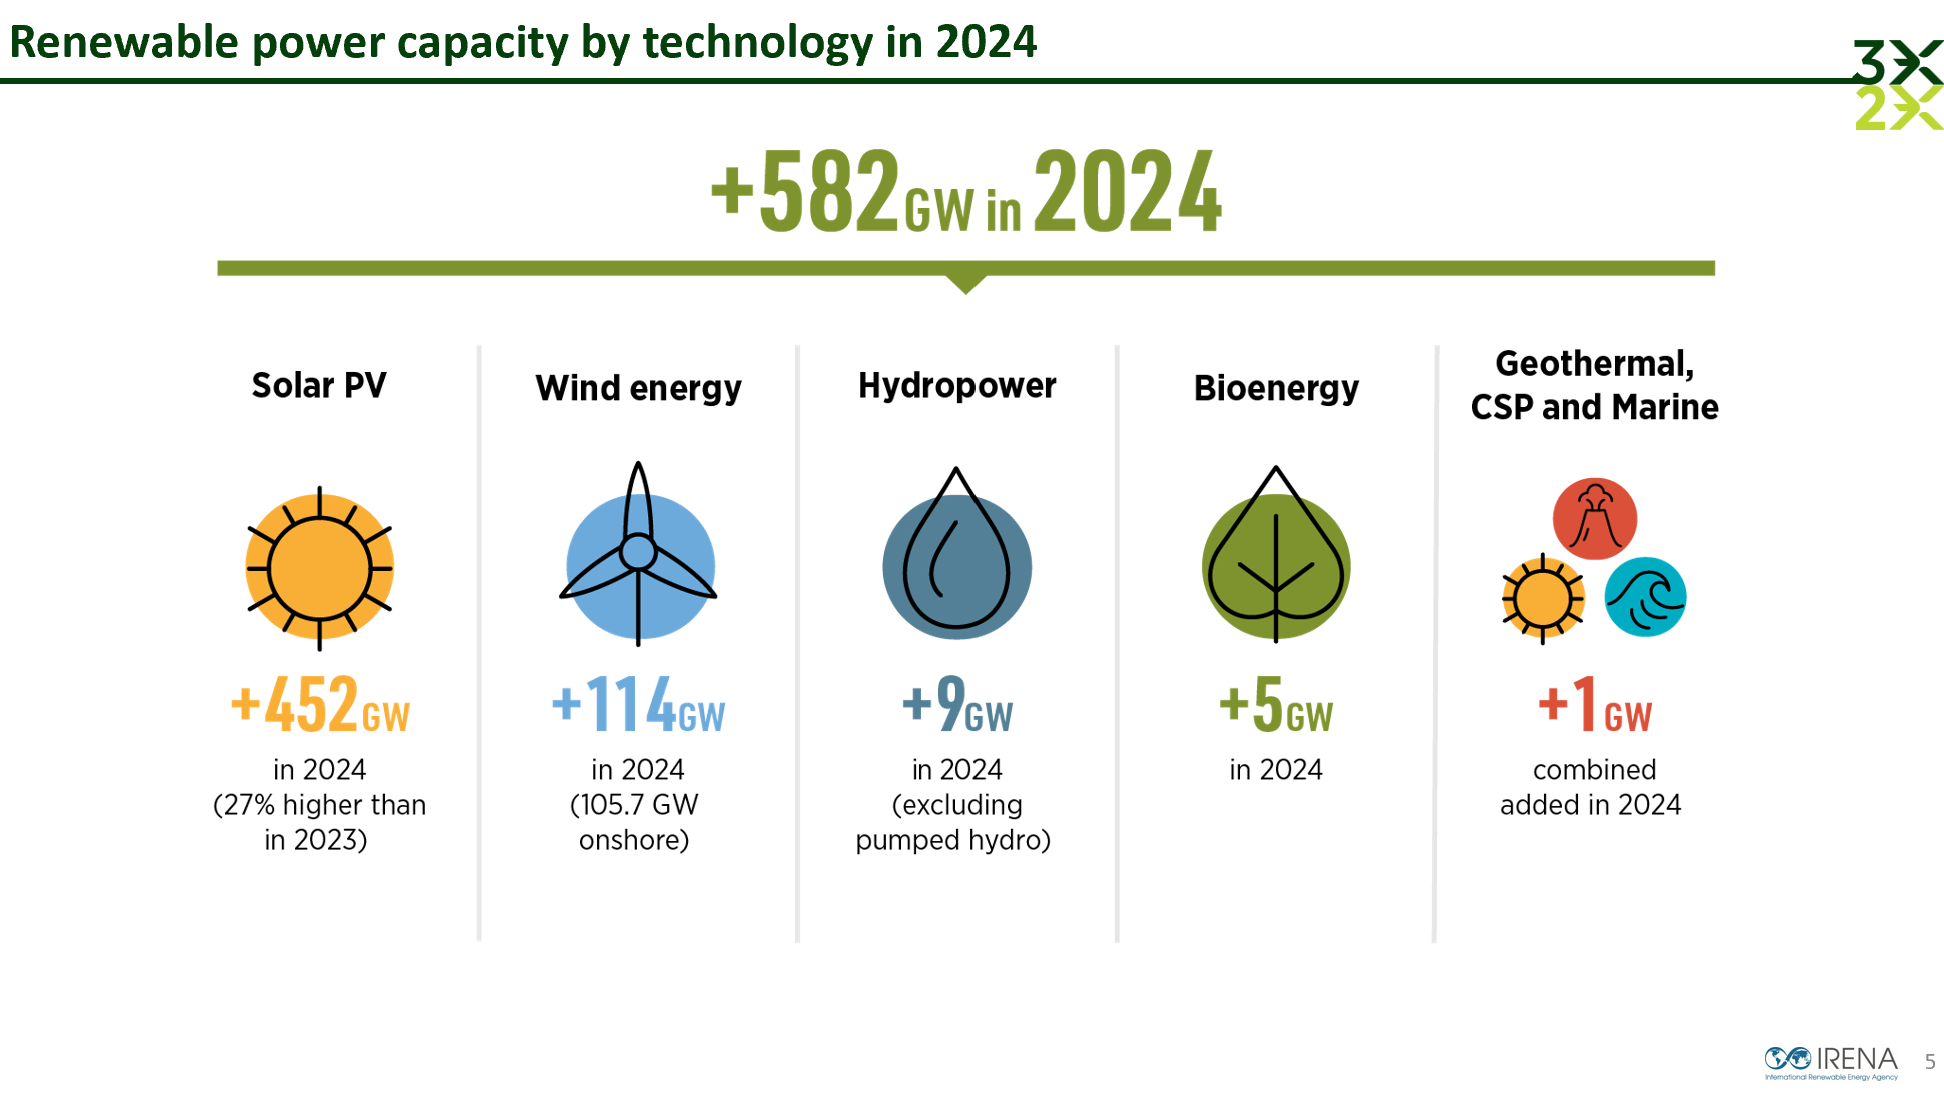
The composition of this growth reveals a stark technological imbalance. Solar PV is a clear success story, with deployment on track to meet or even exceed its 2030 target. However, this overperformance cannot compensate for the significant lag in other critical renewable technologies. The following data reveals the scale of industrial mobilization required, highlighting deep asymmetries across technologies:
- Wind Power: Annual capacity additions must scale up by nearly three times the current rate.
- Hydropower: Requires a threefold increase in annual installations to meet its target.
- Bioenergy: Needs a fivefold increase over 2024 deployment levels.
- Geothermal & Concentrated Solar Power (CSP): Face the most significant challenge, requiring staggering scale-ups of 25 and 27 times their current installation rates, respectively.
This uneven technological progress is mirrored by profound geographic imbalances in deployment, which concentrates progress in a handful of regions while leaving others behind.
1.2 The Geographic Imbalance of Deployment
Progress toward the tripling goal is not uniform, creating a critical vulnerability for an equitable global transition. The deployment of renewable energy is profoundly concentrated in a few key regions, creating a widening gap between developed and developing economies.
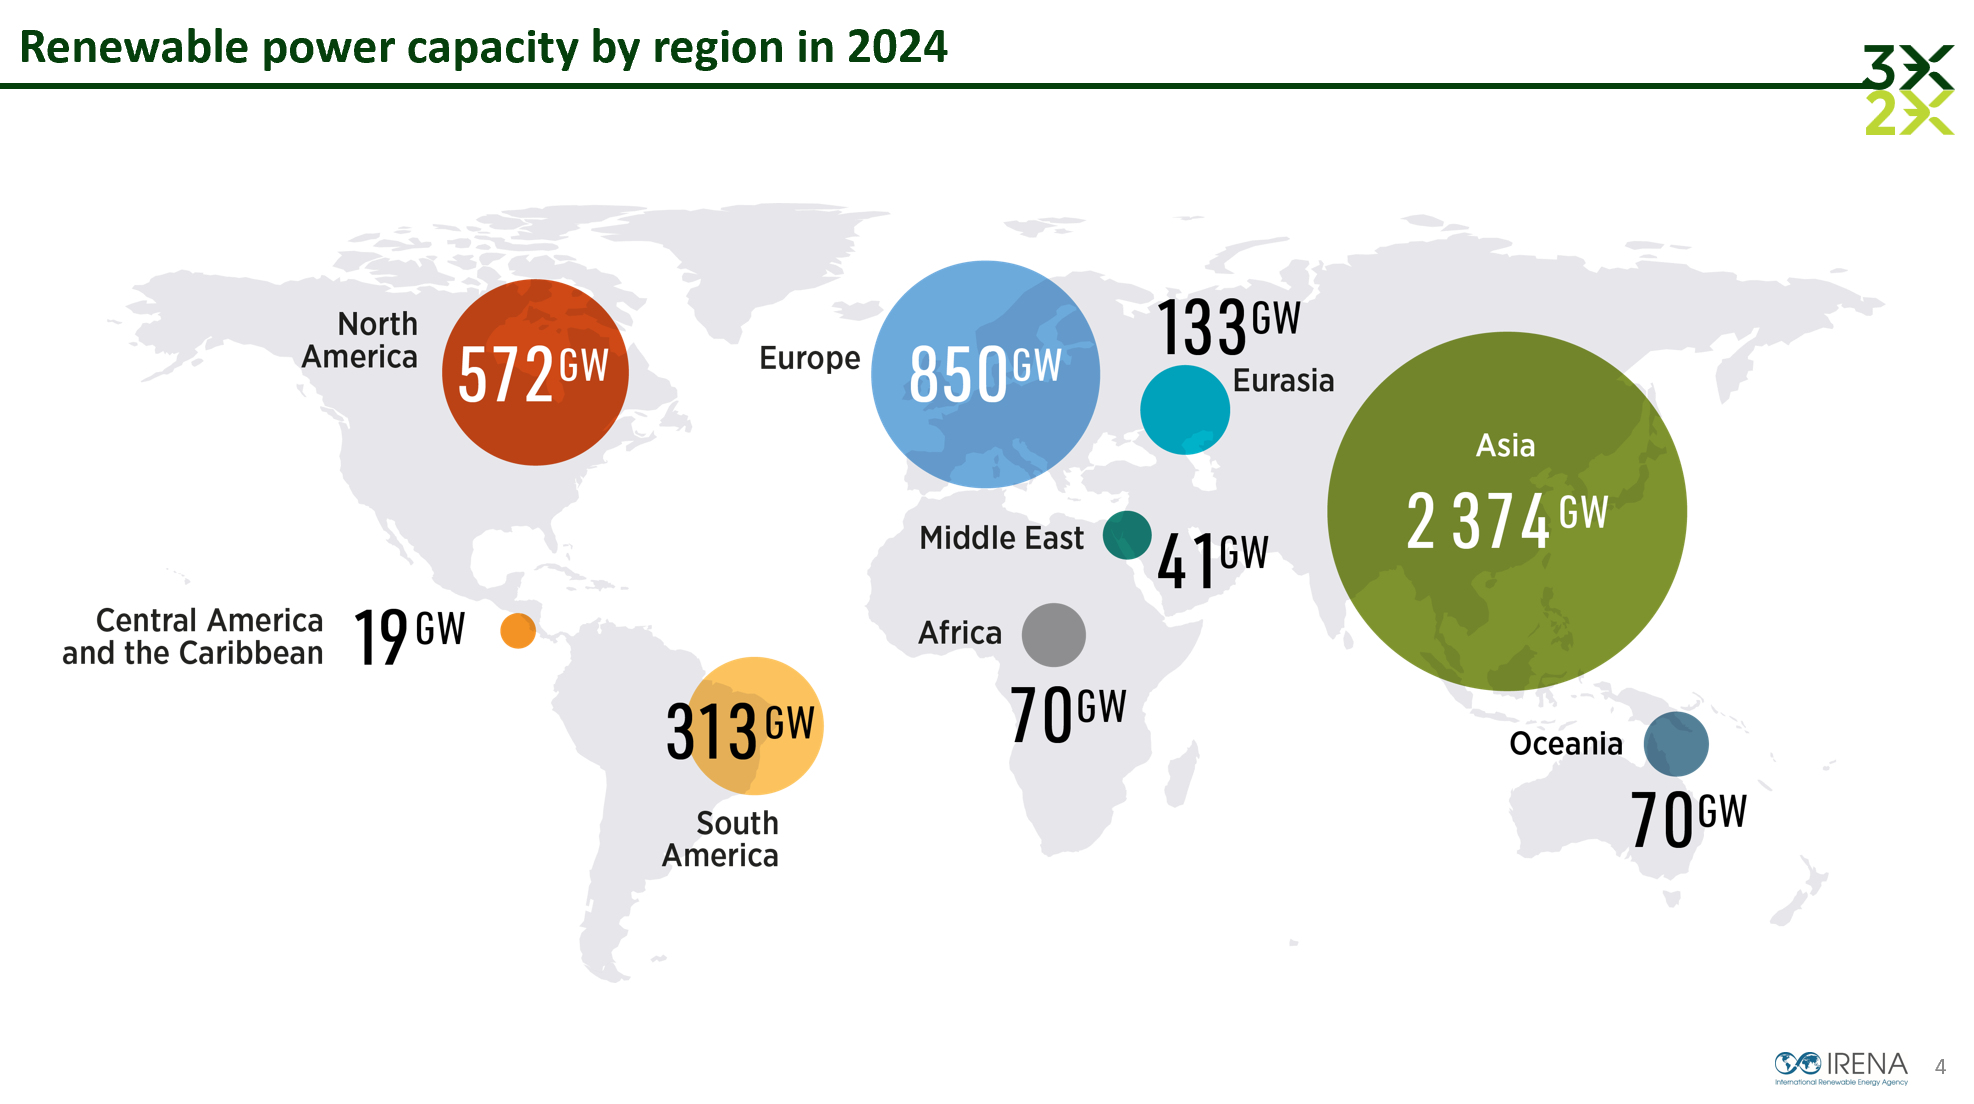
Asia, Europe, and North America account for 85.4% of installed renewable power capacity, leaving only 14.6% for the rest of the world.
This disparity is evident across major economic blocs and developing regions, highlighting where strategic intervention is most urgently needed.
Regional Deployment Snapshot (2024)
Region/Bloc | 2024 Capacity Added | Strategic Context |
G20 Nations | 563.2 GW | Account for 87% of the required installed capacity under the 1.5°C Scenario. |
European Union (EU-27) | 72.3 GW | On track for strong progress but still needs an 80% increase to meet 2030 targets. |
Africa | 4.7 GW | Represents only 1.6% of the global total; requires a quadrupling of capacity by 2030. |
ASEAN Region | 5.2 GW | Must triple its capacity, requiring annual additions of 43 GW, up from 5.2 GW in 2024. |
This geographic disparity is not accidental; it is a direct mirror of a global investment landscape where capital flows follow perceived safety, creating a vicious cycle that starves the highest-potential regions of the financing needed to become bankable.
2.0 The Investment Chasm: Capital Flows and Financial Headwinds
While deployment and supply chains present physical hurdles, the primary bottleneck constraining the global energy transition is a profound misalignment of capital. Despite record investment levels, a significant chasm exists between current capital flows and required amounts, particularly in the regions that need it most. This section dissects the global investment landscape, identifying the primary financial barriers that must be overcome and the opportunities that await if capital can be successfully mobilized at scale.
2.1 The Capital Concentration Problem: Record Investment Fails to Reach Global Scale
Global investment in renewable power capacity reached a record USD 624 billion in 2024. While a landmark achievement, this figure is less than half of the USD 1.44 trillion required annually to meet the tripling goal, leaving an annual investment gap of over USD 800 billion. Furthermore, these investments are highly concentrated, with 77% flowing to just three economies: China, the European Union, and the United States.
Investment trends vary significantly by technology, reflecting both market dynamics and policy support:
- Solar PV: Investment soared to USD 436 billion, attracting more capital than all other renewable technologies combined.
- Wind Power: Experienced a pronounced decline, with investment in offshore wind falling by 28% and onshore wind by 6% compared to the previous year.
- Hydropower & Bioenergy: Showed significant growth, with investments increasing by approximately 45% for each technology.
2.2 The Critical Bottleneck in Emerging Economies
The most acute financing challenges are concentrated in Emerging Markets and Developing Economies (EMDEs), excluding China. These regions are being largely left behind in the global investment surge, receiving only one-fifth of the required investment in 2024. For investors, this "triple challenge" represents both the highest barrier to entry and, if surmounted, the most significant source of potential returns:
- Scaled-Up Need: To meet their share of the tripling goal, EMDEs require an estimated USD 2 trillion in debt and USD 1 trillion in equity by 2030.
- High Cost of Capital: Perceived sovereign risk drives up finance rates, which can be two to five times higher than in advanced economies for similar projects, rendering many commercially unviable.
- Low Availability of Finance: This elevated risk perception limits access to capital, particularly the "first-loss" equity capital essential for getting early-stage projects off the ground.
2.3 The Energy Efficiency Investment Gap
Investment in energy efficiency, the second pillar of the UAE Consensus, is severely lagging and presents a major risk to achieving the 2030 goals. In 2024, only USD 348 billion was invested in efficiency measures globally. This stands in stark contrast to the required average of USD 2.6 trillion annually, creating a staggering annual shortfall of over USD 2.2 trillion for energy efficiency alone. This necessitates more than a sevenfold increase in investment.
This severe underinvestment in both deployment and efficiency is compounded by acute physical constraints in manufacturing and infrastructure, where capital concentration has created its own set of paradoxical risks: oversupply in one sector and critical bottlenecks in others.
3.0 Navigating a Fractured Supply Chain: Concentration, Competition, and Critical Risks
Even if capital were limitless, the physical and geopolitical realities of today's supply chains present a separate and equally formidable set of strategic risks. Beyond financing, the physical supply chains for renewable technologies present a complex landscape of geographic concentration, industrial overcapacity, and emerging bottlenecks. This section evaluates the key supply chain risks and geopolitical factors that executives and investors must understand to de-risk their strategies and capitalize on the transition.
3.1 The Solar PV Paradox: Oversupply and Geopolitical Friction
The global solar PV supply chain is characterized by a unique paradox: massive manufacturing overcapacity coexisting with rising geopolitical tensions. Global capacity utilization for PV manufacturing stood at just 46% in 2024, a situation driven primarily by China, which produced 82% of the world's PV modules. This dominance has driven down costs but has also created vulnerabilities and prompted protectionist responses.
Reshaping Global Trade Flows. Tariffs and trade measures imposed by the United States have curtailed direct imports from Chinese manufacturers and redirected investment and production to Southeast Asia and India. This has created new nodes in the supply chain but also introduced new vulnerabilities.
Emerging Corridor Risk. For instance, Indian exporters, who have rapidly scaled production to serve the US market, now face a new 25% US tariff scheduled for August 2025, threatening to disrupt this emerging trade corridor.
3.2 Structural Constraints: From Wind Sector Headwinds to a System-Wide Grid Crisis
While solar faces overcapacity, the supply chains for wind power and grid infrastructure are defined by emerging bottlenecks that threaten to constrain deployment. The wind supply chain is bifurcated: Chinese firms account for 70% of global turbine orders but primarily serve their vast domestic market. Meanwhile, European manufacturers, who lead in most international markets, are facing acute financial distress and eroding bankability due to inflation and supply chain disruptions.
A more systemic crisis is brewing in grid infrastructure, which has become a systemic, long-term constraint on growth that now represents the single greatest physical barrier to meeting the 2030 goals. The key constraints are multifaceted:
- Soaring Demand: Unprecedented demand for components has pushed lead times for critical equipment like transformers to between 2.5 and 2.8 years in the United States.
- Rising Costs: The price of high-voltage electricity cables has nearly doubled since 2019, adding significant cost to essential grid expansion projects.
- Project Delays: Grid connection queues are expanding globally. In the US, the average wait time for new projects to connect to the grid has increased to more than four years.
These supply chain and infrastructure challenges underscore the urgent need for robust and ambitious policy frameworks to create the enabling conditions for a successful transition.
4.0 Strategic Enablers and Policy Imperatives
Overcoming the formidable obstacles in finance and supply chains is not possible without a concerted and ambitious push on policy, regulation, and international cooperation. The gap between ambition and reality can only be closed by translating high-level goals into concrete, bankable, and actionable national strategies. This final section outlines the critical policy and financial mechanisms that must be strengthened to achieve the 2030 targets.
4.1 Assessing Policy Ambition vs. Reality
A significant gap persists between the internationally agreed-upon goals of the UAE Consensus and the formal commitments made by nations. Analysis of national targets reveals a stark disconnect that must be addressed in the next round of climate pledges:
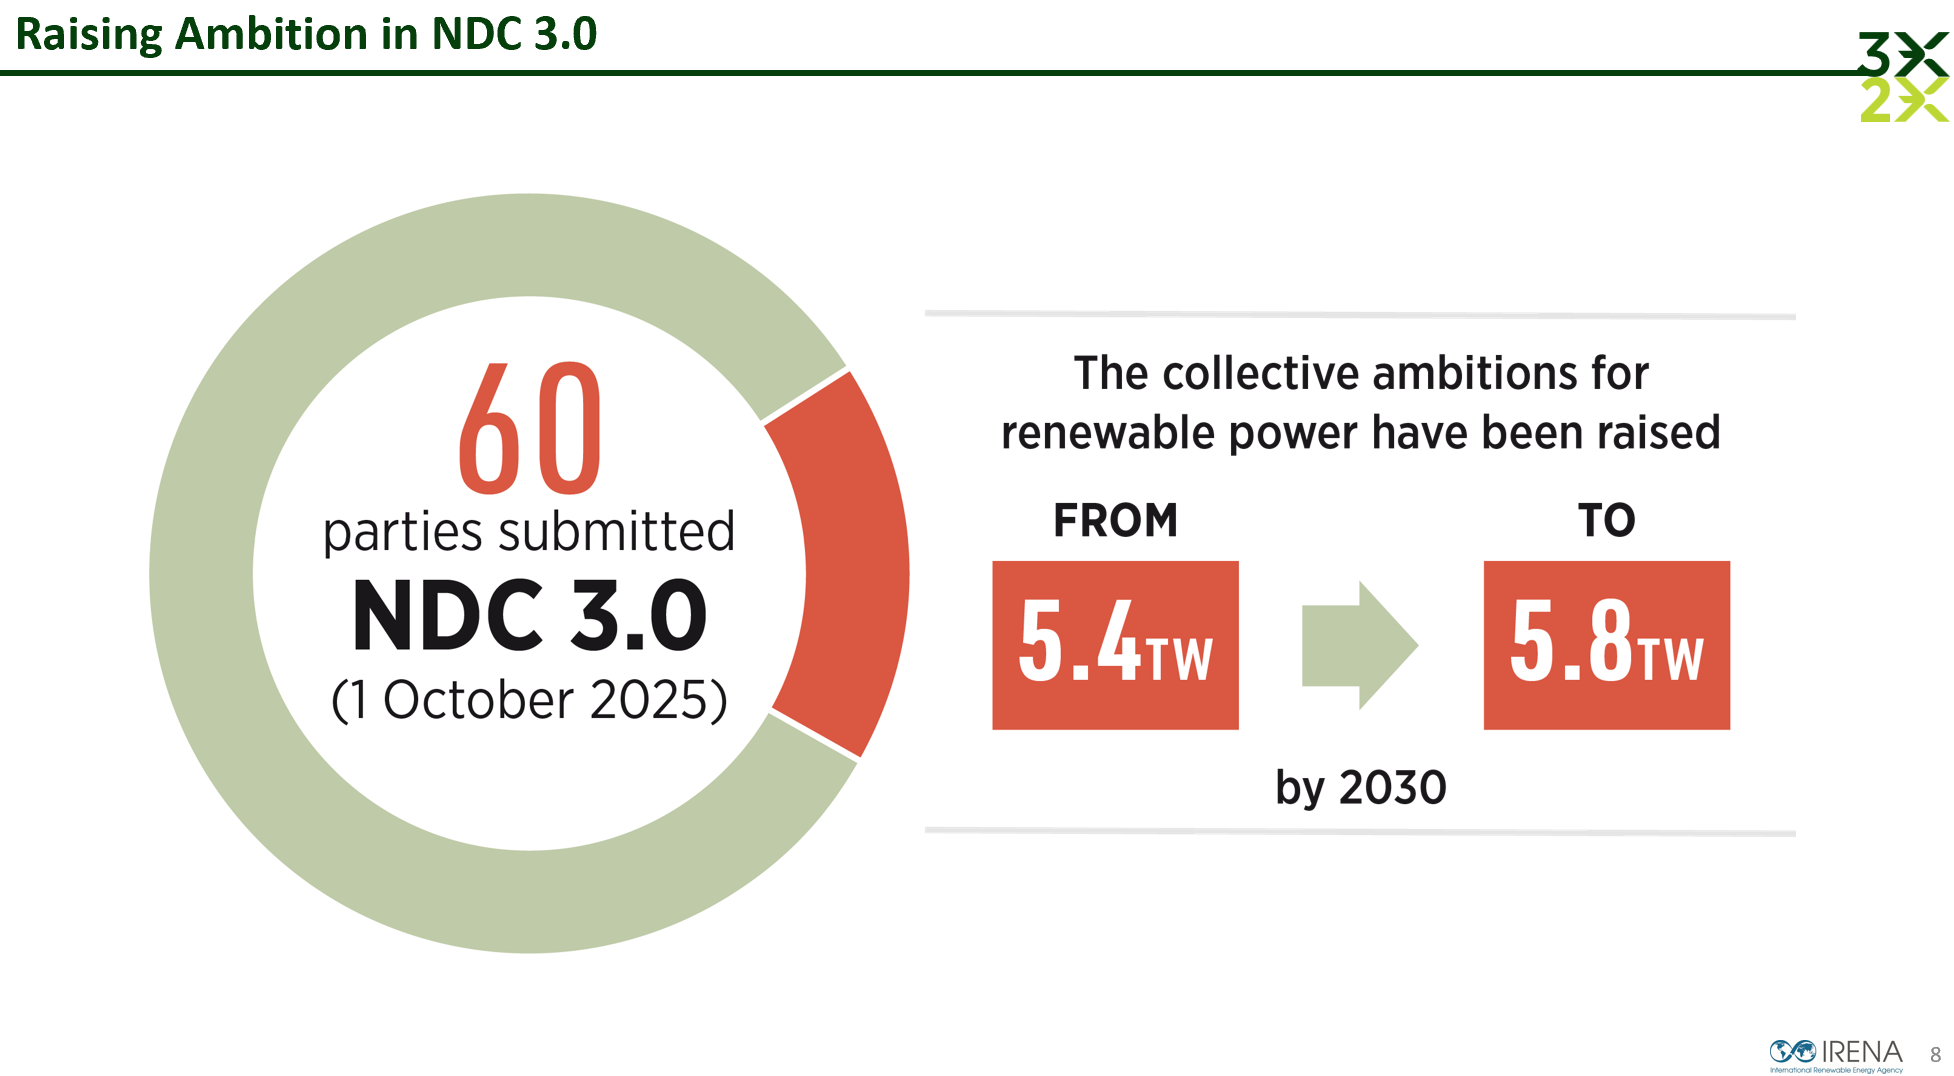
- Ambition outlined in national energy plans and policies collectively targets 7.4 TW of renewables by 2030.
- Formal commitments in official Nationally Determined Contributions (NDCs) submitted to the UNFCCC are even less ambitious, targeting only 5.8 TW.
- Both of these figures fall drastically short of the 11.2 TW of installed capacity required by the 1.5°C Scenario.
This challenge is magnified by the conditionality of targets in the world's most vulnerable nations. In Least Developed Countries (LDCs), 60% (38 GW) of targeted renewable capacity is conditional on receiving international financial assistance. Fulfilling these conditional targets alone would require an estimated USD 71 billion from international sources, highlighting the inextricable link between policy ambition and financial reality.
4.2 Reforming International Finance to Unlock Capital
To enable a truly global transition, international public finance must be reformed to better support the unique needs of EMDEs. While commitments are growing, the current structure and distribution of financial flows remain misaligned with what is required to unlock capital at scale in the regions that need it most.
Key issues with current international public financial flows include:
- Uneven Distribution: Flows are highly concentrated in a small number of countries. LDCs, which stand to benefit most from concessional finance, received only 3% of the total public flows in 2023.
- Debt-Heavy Approach: Debt-based instruments accounted for 83% of public finance in 2023. This approach exacerbates debt burdens and fails to provide the high-risk equity capital that is essential for early-stage project development.
- Insufficient Scale: The USD 21.6 billion in public flows to developing countries in 2023 remains far below the scale required to de-risk and attract private capital, and is still below the peak level seen in 2016.
Delivering on the USD 300 billion annual commitment of the New Collective Quantified Goal (NCQG) and effectively deploying de-risking tools and blended finance platforms will be critical. Ultimately, success hinges on a paradigm shift: policymakers must view ambitious NDCs not as a cost but as a prerequisite for de-risking private capital, while investors must recognize that the fractured supply chains and geographic imbalances detailed herein represent not just risk, but the primary alpha-generating opportunity in the energy sector for the coming decade.
Note) The above detailed summary was put together with the help of AI and reviewed by a human being, me.
About Obsidian Odyssey
Obsidian Odyssey explores the intersection of capital, consciousness, and long-term stewardship. Subscribe for weekly executive reflections on sustainable investing, leadership, and the future of capitalism — written for CIOs, portfolio managers, and next-generation capital architects.
![Obsidian Memo] Leadership Ground Truth: What Cuba, Puerto Rico, and Hawai'i Taught Me About Capital and Resilience](/content/images/size/w720/2026/02/Bad-Bunny.jpg)
![Obsidian Memo] The Great Re-Entry: Strategic Realignment and the Industrialization of Private Capital in the 2026 Financial Services Landscape](/content/images/size/w720/2026/02/photo-1496989981497-27d69cdad83e.jpeg)
![Obsidian Memo] Nature Finance & Circular Economy in Practice: A Sustainable Investing Perspective](https://images.unsplash.com/photo-1571785983781-3317703d64a6?crop=entropy&cs=tinysrgb&fit=max&fm=jpg&ixid=M3wxMTc3M3wwfDF8c2VhcmNofDEyfHxiaW9kaXZlcnNpdHl8ZW58MHx8fHwxNzcwOTU2NzQ3fDA&ixlib=rb-4.1.0&q=80&w=720)
Comments ()